Hong Kong Accreditation Service (HKAS) arranged "Analytical Quality Training Programme" from 9 to 13 Jan 2012. LGC experts were invited to provide this training. LGC is the UK’s designated National Measurement Institute for chemical and biochemical analysis , the National Reference Laboratory for a range of key areas, and is also the host organisation for the UK’s Government Chemist function.
The second training topic was "Method Validation" from 10 to 11 Jan 2012. The training content was summarized for sharing.
Method Validation (Part 2 on 11 Jan 2012)
Firstly, Dr. Stephen Ellison discussed "Selectivity". Selectivity and specificity relate to the ability of a method to provide an accurate answer in the presence of potential interferents.

Dr. Stephen Ellison briefed the definitions as follows:
[IUPAC]: Selectivity - The extent to which the method can be used to determine particular analytes in mixtures or matrices without interferences from other components of similar behaviour.
[ICH]: Specificity - ... the ability to assess unequivocally the analyte in the presence of components which may be expected to be expected to be present.
Then he introduced some typical experiments to identify interferents. (Usually use in biological material)

During the workshop, we identified the interferents through the results of interference check. In this example, Aniline and Ethanolamine were identified because it had much higher effects (+0.164 mg/l and + 0.114 mg/l) than typical standard deviation (0.002 mg/l and 0.007 mg/l).

After that Dr. Stephen Ellison discussed "Detection Limit". In some applications, particularly clinical and medical, the term sensitivity is often associated with the lower limit of applicability of a method. He told us three concepts to consider in discussing the lower limit of performance of a method below.
Critical Value - instrument response used to trigger action
Detection Limit - amount of substance leading to action
Quantitation Limit - lowest level at which uncertainty is acceptable
(An interesting statement quoted in the note from Kurtz (1988) about detection limit is "The usual reason we want to measure a detection limit is to stay away from it".)
(Another course entitled "Statistics for Method Validation" organized by HKAS on 27 Oct 2011 had also discussed it.)

The following diagram showed setting limits to control errors. There were two types of error.
1. False positive: (Type I error - α) Wrongly declaring a substance to be present
2. False negative: (Type II error - β) Wrongly declaring a substance absent

The following two diagram showed the equations to calculate critical value and detection limit.
where
x0 is a correction term to deal with baseline (or blank sample, correction)
s is the standard deviation observed during the LoD estimation study
kl is a constant used to correct s.
t(v,α) is the one-tailed value of Student's t for a probability α and v degrees of freedom (v=n-1).

The table showed How to choose x0 and kl.
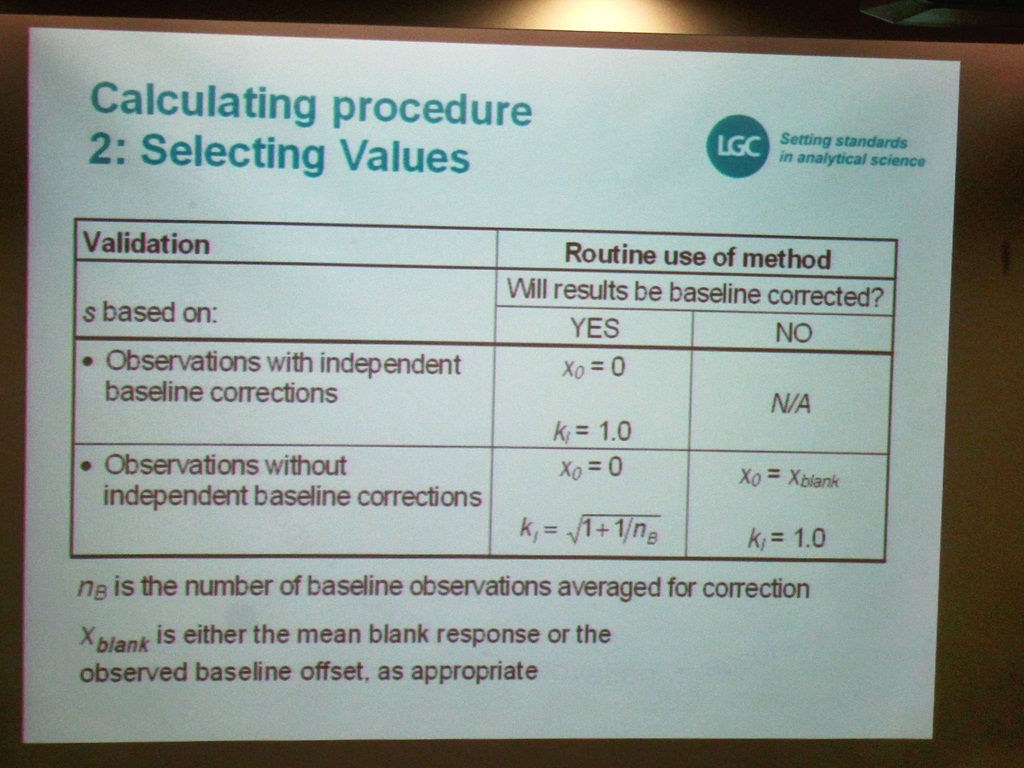
Instrument's detection limit (iDL) estimated from some measure of the noise. The principle is very similar to setting a limit from the standard deviation of blank values; simply mulitply the standard deviation of the noise sn by an appropriate factor (usually 3). iDL = baseline + 3 * sn

In the second session, Ms. Barwick introduced "Linearity and Working Range". Linearity was "Defines the ability of the method to obtain test results proportional to the concentration of analyte." (AOAC-PVMC).

The diagram showed a typical response curve. Ms. Barwick said to establish what calibration strategy was appropriate which based how many levels and replication at each level.

Ms. Barwick discussed the linearity between instrument and whole method. The following diagram showed some calibration could be non-linear. Some theory / experience indicated that a particular technique should follow a known mathematical function.

Another workshop was to develop a validation plan based on Selectivity, Detection Limit and Linearity/working range.

Last topic was briefed by Dr. Stephen Ellison. It was "Measurement uncertainty and validation studies". ISO definition of measurement uncertainty is "A parameter, associated with the result of a measurement, that characterises the dispersion of the values that could reasonably be attributed to the measurand".

Dr. Stephen Ellison introduced five steps to quantify Measurement Uncertainty.
1. Specify what is being measured
2. For each stage of the measurement procedure list sources of uncertainty
3. Quantify the uncertainty components
4. Combine the values
5. Multiply by "coverage factor" (k)
The following diagram showed the step 3.

Finally, Dr. Ellison mentioned Measurement Uncertainty in different real situations below.
1. Collaborative trial method (self-explanatory)
2. In-house validation studies (self-explanatory)
3. Ad-hoc methods (exploratory studies in the short term)
4. Empirical methods (a standardized method agreed on for comparative measurement within a particular field of application)
Collaborative trial method (refer to ISO 21748)
- bias and precision verified in-house
- main effects studied by developers

In-house validation study
- precision, bias, major effects

Empirical methods (Coverage)
- it is nearly always collaboratively trialled before standardizing.

Reference:
HKAS - www.hkas.gov.hk
LGC - http://www.lgc.co.uk/
Kurtz et al in LA Currie (ed) (1988) Detection in Analytical Chemistry. Importance, Theory and Practice, American Chemical Society, Washington DC.
ISO 21748: Guidance for the use jof repeatability, reproducibility and trueness estimates in measurement uncertainty estimation.

沒有留言:
發佈留言