Hong Kong Accreditation Service (HKAS) arranged "Analytical Quality Training Programme" from 9 to 13 Jan 2012. LGC experts were invited to provide this training. LGC is the UK’s designated National Measurement Institute for chemical and biochemical analysis , the National Reference Laboratory for a range of key areas, and is also the host organisation for the UK’s Government Chemist function.
The third training course named "Evaluating Measurement Uncertainty" from 12 to 13 Jan 2012. The training content was summarized for sharing.
Measurement Uncertainty (Part 2 on 13 Jan 2012)
Dr. Stephen Ellison continued the training and the morning topic named "Using data from validation studies". Most of content in this session was similar to the course "Method Validation - Part 2" on 11 Jan 2012. Such as the following methods employed for routing testing:
1. Collaborative trial method (self-explanatory)
2. In-house validation studies (self-explanatory)
3. Ad-hoc methods (exploratory studies in the short term)
4. Empirical methods (a standardized method agreed on for comparative measurement within a particular field of application)

He mentioned a "Fast Track" to measurement uncertainty estimates through effective data use. The diagram showed general procedure for uncertainty estimation. Then he summarized three points. They were to exam validation data, to check if any sources of uncertainty covered and factors not covered.

Ms. Vicki Barwick presented the topic "Cause and effect analysis - A tool for uncertainty estimation". She briefed five steps for uncertainty estimation below.
1. Specify what is being measured
2. For each stage of the measurement procedure list sources of uncertainty
3. Quantify the uncertainty components (Included Type A and B uncertainties)
4. Combine the values
5. Multiply by the coverage factor

She introduced four method to resolve duplication after constructed cause and effect diagram. There were:
1. Cancelling effects (Remove factors which had no net effect on the result)
2. Combining factors (Same effect, same time)
3. Re-labeling factors (Different instances)
4. Additional measures (restructure to group similar effects)

The following case showed combining (2) and grouping (4) the factors such as Temperature and Precision.

Cancellation (1) of the calibration bias was showed in the following case.

Reduced ambiguity in the following diagram showed Re-labeling (3) effect.

After that Ms. Vicki Barwick lead a Workshop named "Estimating the uncertainty for a complete analytical method - The determination of cholesterol by gas chromatography".
The scope of method was "The determination of cholesterol in animal and vegetable fats and oils" and the calculation formula was showed as follows.

The typical chromatogram was showed.

The final cause and effect diagram was illustrated and the workshop requested to resolue the duplication.

Afternoon session, Dr. Stephen Ellison introduced "Dealing with recovery data" which uncertainties associated with bias estimates. There were two main components that Rm was the method recovery and Rs was the matrix effect.

The following diagram was demonstrated the Rm. Rm = Cobs / Ccert
With u(Rm) = Rm x √{(u(Cobs)/Cobs)^2 + (u(Ccert)/Ccert)^2}
There were four cases:
Case1: Rm is not significantly different from 1 and no correction
Case2: Rm is significantly different from 1 and correction applied
Case3: Rm is significantly different from 1 and no correction (for operational reasons)
Case4: An empirical method is in use.

Case 1 - insignificant bias

Case 2 - with correction

Case 3 - without correction
The ISO approach did not allow for this situation. This allows the customer to decide for themselves how to deal with the recovery issue, and to estimate the uncertainty should they decide to correct the value.

Case 3 - without correction but increasing reported uncertainty

Overall uncertainty for bias with contribution of matrix effects was formulated as follows.

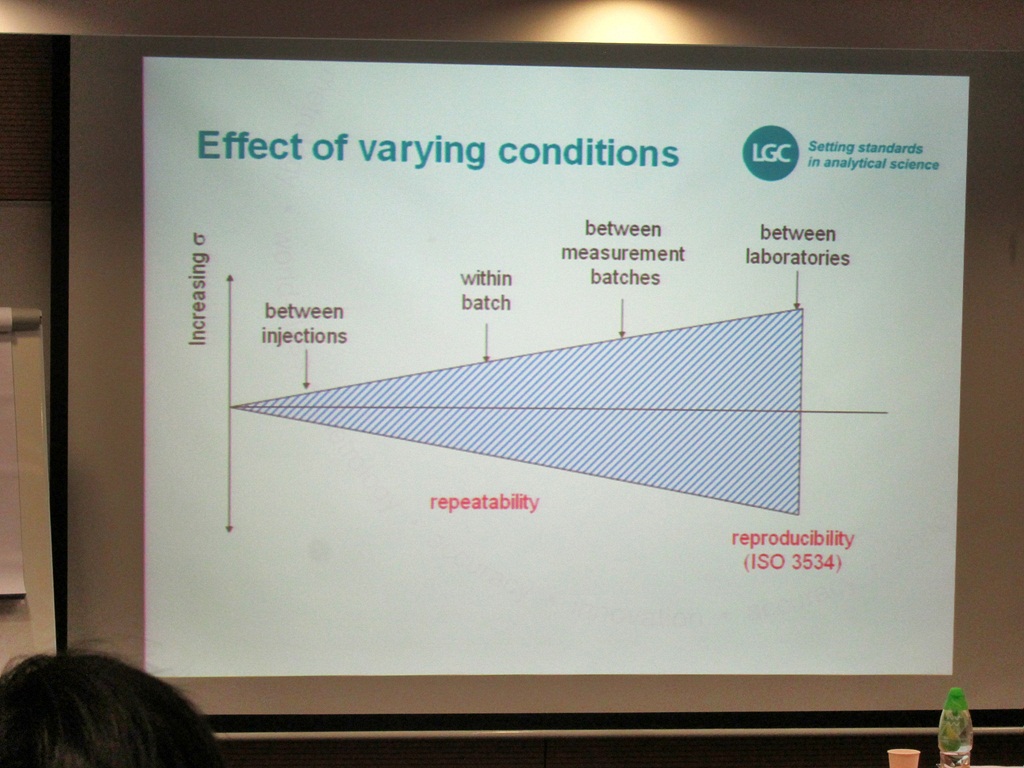
After that Ms. Vicki Barwick discussed "Precision data from validation".

Firstly, she explained the variation increased from repeatability condition (within batch) to intermediate precision (between measurement batches) to reproducibility condition (between laboratories).
The following table showed the effect of different factors. It was found that sample preparation and extraction were most important in these three conditions.

The following diagram showed a model of the relationship between measurement uncertainty and precision experiments. Its implication was "A factor that was representatively varied during the course of a precision experiment requires no further study".

"Precision from several estimates" was very important topic. It was due with different matrix or concentration level sample to calculate pooled relative standard deviation (pooled rsd).

The model would be used for calculating uncertainty at a single analyte concentration / precision.

The model would be used for calculating uncertainty over a range of analyte concentrations (precision proportional to concentration).

Dr. Stephen Ellison briefed other effects in validation studies. He discussed four common methods for considering additional effects included "Significance tests", "Calculations", "Experiments" and "Professional Judgement".

Calculations based on "worst case" changes in an uncertainty source was able to show quickly whether an effect was worth pursuing. Typical criteria were demonstrated.

Finally, Ms. Vicki Barwick presented the uncertainty for large concentration.

The diagram showed the uncertainty for routine methods included fixed term (s0) and concentration-dependent term (xs1). The two contributions were separately and as a combined curve in solid line. There were three regions.
Region A (Low levels): The uncertainty was generally effectively independent of observed analyte concentration.
Region C (High levels): The uncertainty was come from the concentration-dependent term and the contribution of fixed term was negligible.
Region B (Intermediate levels): The uncertainty estimation was neither dominated by a fixed term, nor by a relative term. (Further details in EURACHEM guide)

Last but not least, Dr. Stephen Ellison taught us "Using and conveying uncertainty information.

We discussed the interpretation against limits. Dr. Ellison said it only concluded that result (a) was compliance and result (g) was non-compliance. For more information, please refer to "Use of uncertainty information in compliance assessment" in Eurachem website.

Dr. Ellison (LGC, UK) is one of editors of EURACHEM/CITAC Guide "Quantifying Uncertainty in Analytical Measurement" Second Edition (2001). I am pleasure to have his signature in my guide which I kept for more than ten years.

Reference:
HKAS - www.hkas.gov.hk
LGC - http://www.lgc.co.uk/
ISO/IEC 17025: General requirements for the competence of testing and calibration laboratories
UKAS M3003: The Expression of uncertainty and confidence in measurement - www.ukas.com
EA-4/16 EA Guidelines on the expression of uncertainty in quantitative testing - www.european-accreditation.org
ILAC G17:2002 Introducing the concept of uncertainty of measurement in testing in association with the application of the standard ISO/IEC 17025 - www.ilac.org
B Magnusson & S LR Ellison (2008) "Treatment of uncorrected measurement bias in uncertainty estimation for chemical measurements" Analytical and Bioanalytical Chemistry 390, pp201-213.
Use of uncertainty information in compliance assessment - www.eurachem.org

沒有留言:
發佈留言