Hong Kong Accreditation Service (HKAS) arranged "Analytical Quality Training Programme" from 9 to 13 Jan 2012. LGC experts were invited to provide this training. LGC is the UK’s designated National Measurement Institute for chemical and biochemical analysis , the National Reference Laboratory for a range of key areas, and is also the host organisation for the UK’s Government Chemist function.
The second training topic was "Method Validation" from 10 to 11 Jan 2012. The training content was summarized for sharing.
Method Validation (Part 1 on 10 Jan 2012)
Firstly, Dr. Stephen Ellison presented the topic named "Introduction to method validation". The definition of "Validation" in ISO/IEC 17025 is "Confirmation by examination and the provision of objective evidence that the particular requirements for a specific intended use are fulfilled". Dr. Ellison said the three important parts of validation are "specific intended use", "objective evidence" and "confirmation".

He explained why method validation was necessary. It was because of four dimensions to be considered such as Ethical, Commercial, Regulatory and Quality Assurance. For validation plan, the following parameters should be concerned. They were "Selectivity/specificity", "Trueness", "Precision", "Working Range", "Robustness" and "Sensitivity".

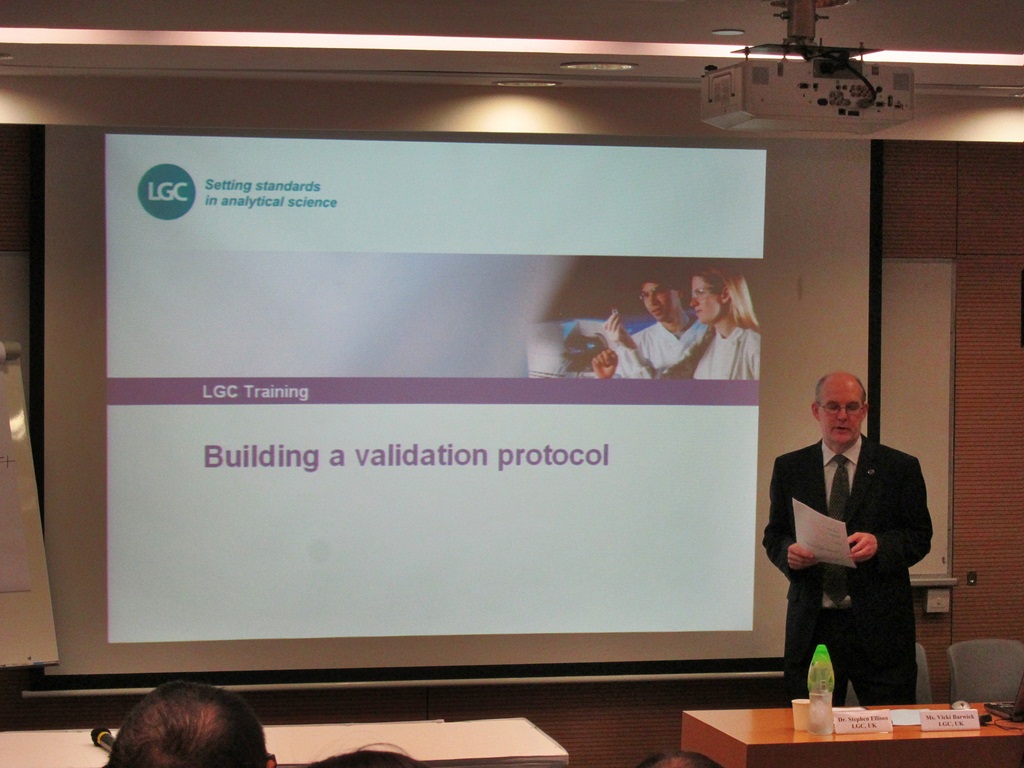
The Dr. Ellision told about how to build a validation protocol. It included "Purpose", "Performance Criteria", "Test Plan" and "Interpretation".
Method validation is a process of developing a sufficient picture of a method's performance to demonstrate that it is fit for use (or an intended purpose). The validation puzzle was shown. Dr. Ellision said we needed to decide what parts of the puzzle were essential and how sharp a focus was necessary.

Ms. Vicki Barwick presented the topic "Precision". Based on ISO 3534-2006, Precision defined as "The closeness of agreement between independent test/measurement results obtained under stipulated conditions".

Then she introduced different precision estimates as follows:
1. Repeatability - same lab, analyst, equipment, short time interval (it typically used for studying variation within a batch of analyses)
2. Intermediate precision - within lab variation, different days, analysts, equipment
3. Reproducibility - different lab, analysts, equipment (it typically used to study between laboratory variation in measurements)
The following diagram showed the effect of varying conditions.

The following diagram showed the confidence interval for the population standard deviation (σ), plotted against the number of independent replicates (n). It was observed that (n) beyond around 15 replicates had little change in the confidence interval.

Besides, Ms. Vicki Barwick introduced the structure and analysis of nested designs to evaluation the method's precision. It could be use analysis of variance (ANOVA) to compare the variation in results between days, with the variation within days.

The following diagram showed the formula of the standard deviation of intermediate precision (Sbetween). The standard deviation of precision was Swithin and the standard deviation of reproducibility was Sc.

Lastly, Ms. Barwick mentioned about the comparison between results by using precision limits. The general form of the precision limit (r) is: r = t * Sr * √2

After that Dr. Stephen Ellison briefed the Bias which was different between observed mean value and reference value.
There were three expressions of bias as follows.
- Absolute value: x - x0
- Fraction or Percentage: (x - x0)/x0 or 100 * (x - x0)/x0
- Recovery (Fraction or Percentage): x/x0 or 100 * x/x0

Different situations demonstrated the statistical and practical significance bias. They were not necessarily the same.

Designing experiments to study the bias of a new analytical method, the sufficient replicates required. The following diagram showed the relationship between the change in standard deviation and number of replicates.

The last session, Ms. Vicki Barwick introduced "Ruggedness Testing" (also named Robustness Testing). It was defined as "Intra-laboratory study to examine the behaviour of an analytical process when small changes in the environmental and/or operating conditions are made ... Allows information to be obtained on effects of minor changes in a quick and systematic manner" by Association of Official Analytical Chemists - Peer Verified Methods Committee (AOAC-PVMC).

Ruggedness testing used to identify which parameters were required control when the method was used routinely. Therefore, it needed to identify key method parameters and used the results of ruggedness testing to control these key parameters. The typical key parameters were showed below.

Ms. Barwick briefed the Plackett-Burman experimental design as follows:
1. Identify 7 experimental parameters (A to G) for study
2. Identify normal (A to G) and alternative (a to g) values for each parameter
3. Carry out experiments on a representative sample or reference material
After run of experiments, calculation of the difference for each parameter was needed.
For parameter A, D(A) = [(s+t+u+v)/4] - [(w+x+y+z)/4], indicating normal results minus alternative results.

And then Ms. Barwick used the t-test to check significance.
The parameters in the diagram means were showed below:
Di = difference observed for parameter i
s = estimate of method precision as a standard deviation
n = number of experiments at each level for each parameter (n=4)
The √2 term is required to take account of the fact that Di is calculated from the difference between two mean values.

At the end, Ms. Barwick used the flow chart to explain how significant parameters on the method was controlled more tightly.

Reference:
HKAS - www.hkas.gov.hk
LGC - http://www.lgc.co.uk/
For study of Bias: NIST special publication 829: Use of NIST Standard Reference Materials for decisions on performance of analytical chemical methods and laboratories.

沒有留言:
發佈留言