The trainer was Mr. Mark Lee and his talk included “Challenges of Forecasting”, “9 Ways of Effective Forecasting” and “Group Discussion”.

In the beginning, Mr. Lee briefed the challenges of forecasting. The follow diagram showed that sales forecast were always incorrect.

Some strategic plans were introduced (from manufacturing to finance).

Mr. Lee stated several challenges to forecast including “Short Product Life Cycle”, “Market Change”, “Without Historical Data” and “Instable Economy” that would cause “Over Inventory”, “Loss of Opportunities”, “Profit Margin Decrease” and “Dissatisfied Customers”.

After that Mr. Lee mentioned the 9 effective ways for forecasting as follow.
1st Way: Don’t confuse “Forecasts” with “Prediction”
Paul Saffo (forecaster based in Silicon Valley, in Califorma) mentioned the difference of “Forecasts” and “Prediction”.
Prediction is concerned with future certainty.
Forecasting looks at how hidden currents in the present signal possible changes in direction for companies, societies, or the world at large.
Primary goal of forecasting is to identify the full range of possibilities, not a limited set of illusory certainties. It should have logic behind.

The following S-Curve indicated the timing uncertainty when people tended to use linear approach for forecasting. It tended to overestimate the short term and underestimate the long term.

2nd Way: Beware of special events and noise contaminating data
Mr. Lee said Out of Stock Situations (OOS) falsify data collected from point of sale (POS) terminal. The wrong signal would contaminate the analysis of data for forcasting.

The diagram showed the loss of sales about 14.3%. The data from loss of sales (fashion retailer) would contaminate the result of next season order.

3rd Way: Short-list multiple models to make your forecasts rather than just one
Mr. Lee asked us to use more than one methodology for forecasts. It could use the previous one or two year’s data to test different forecasting methodology and select the best one.

There were four categories of forecasting methods such as “Judgment Methods”, “Counting Methods”, “Time Series Methods” and “Causal Methods”.
Example of Judgment Methods: Senior/Top management discussed the direction.
Example of Counting Methods: Customer Survey

Example of Time Series Methods: Use past data for analysis
Example of Causal Methods: Find the causal behind the phenomena

The following questions helped to select the forecasting methods.
Time
· Is the forecast period “Present need”, or “Short-, Medium-, or Long-term projection”?
· Is the forecast needed immediately
Resource Requirement
· Are quantitative skills limited?
· Are computer capabilities limited?
Input
· Are only limited past data available?
· Are significant environmental changes expected?
Output
· Are component forecasts required?
· Is a high level of accuracy critical?
4th Way: Consider the impact of pricing
It should not be only consider the sales amount but also consider the price. Under the product life cycle (PLC), it should make sure enough products in the beginning of the PLC and then didn’t keep stock at the end of PLC.

The follow figure showed the large amount of sales based on discount price (Red).

5th Way: Fully utilize the benefits from measure of associated risks
Mr. Lee based on Prof. Marshall Fisher research that 80% companies did not track forecast accuracy.

If we performed forecast verification, we could reduce the risk level in next forecasting.

6th Way: Find the best rhythm to synchronize forecasts and actual results
The diagram showed the forecasting in different departments had different rhythm. It did not match to each other and result could be terrible.

We needed to align their forecasting through regular meeting (e.g. Monthly Sale & Operation Process Meeting).

7th Way: More accurate forecast through early sales data
Its principle was to improve the forecast by using the data after a short term sale (said one or two months)

The diagram showed the much improved forecasts (reduced the variation).

8th Way: Be more accurate is not necessary generating more profits
It should consider the product characteristic and usually separated into functional and Innovative.


9th Way: Align different views among departments
Different level of staff had different views.

The following example demonstrated the time dimension.

It needed to collaborate with each other to build a multi-dimensional database.

Finally, Mr. Lee concluded that a forecast was a combination of Art and Science.

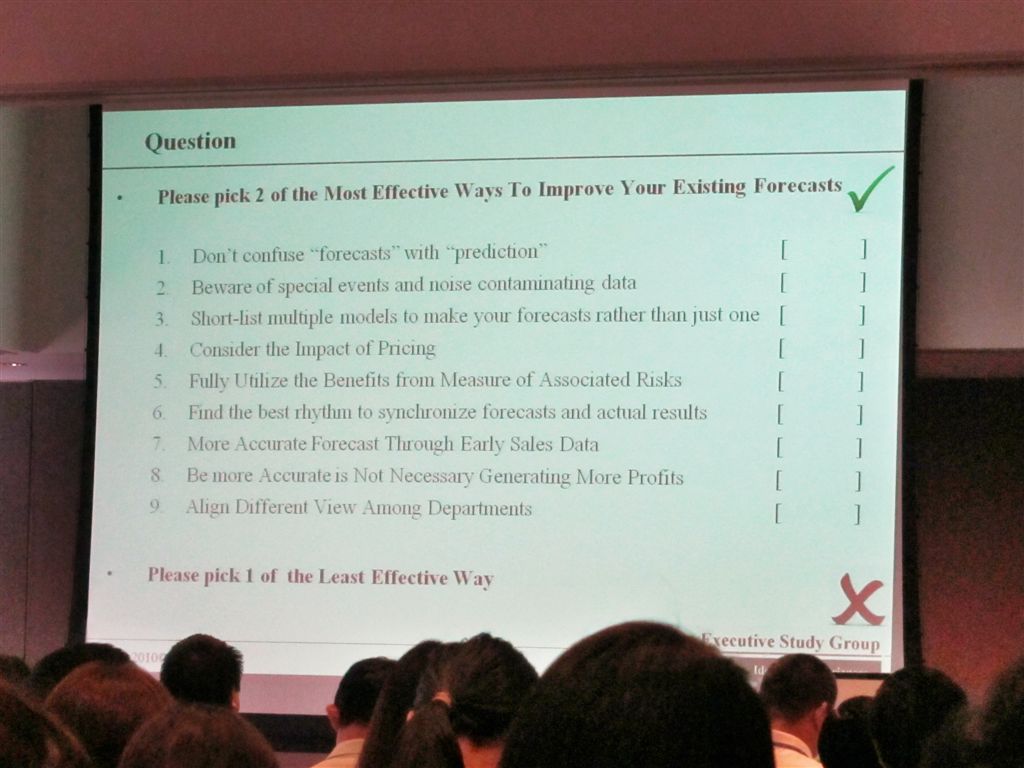
In Group Discussion, it was to rank the 9 ways using 2√and 1X.

For more information:
The Centre for Logistics Technologies and Supply Chain Optimization, CUHK: http://www.logitsco.cuhk.edu.hk/

5th Way: Fully utilize the benefits from measure of associated risks
Mr. Lee based on Prof. Marshall Fisher research that 80% companies did not track forecast accuracy.

If we performed forecast verification, we could reduce the risk level in next forecasting.

6th Way: Find the best rhythm to synchronize forecasts and actual results
The diagram showed the forecasting in different departments had different rhythm. It did not match to each other and result could be terrible.

We needed to align their forecasting through regular meeting (e.g. Monthly Sale & Operation Process Meeting).

7th Way: More accurate forecast through early sales data
Its principle was to improve the forecast by using the data after a short term sale (said one or two months)

The diagram showed the much improved forecasts (reduced the variation).

8th Way: Be more accurate is not necessary generating more profits
It should consider the product characteristic and usually separated into functional and Innovative.


9th Way: Align different views among departments
Different level of staff had different views.

The following example demonstrated the time dimension.

It needed to collaborate with each other to build a multi-dimensional database.

Finally, Mr. Lee concluded that a forecast was a combination of Art and Science.

In Group Discussion, it was to rank the 9 ways using 2√and 1X.
For more information:
The Centre for Logistics Technologies and Supply Chain Optimization, CUHK: http://www.logitsco.cuhk.edu.hk/

沒有留言:
發佈留言