Simitri Hong Kong Limited
was invited to perform a Big Data & Business Analytics Workshop on 30th
April 2018. I was one of participants
and would like to summarize some contents of the workshop. Mr. Philip Chan (Senior Consultant, Simitri)
was our trainer. The workshop objectives were to gain insight
into “Big Data” and how to use to make better decisions. Mr. Philip Chan said Big Data had
characteristic on Bias (偏向性) but not Absolute (絕對性). It based
on past data but did not consider future trend.
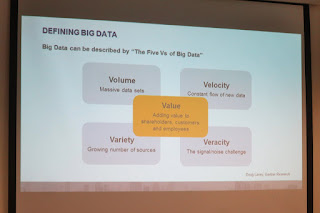
Big Data could be described
by 5 Vs and they were Volume, Velocity, Variety and Veracity, as well as Value.
Then Mr. Philip Chan shared
customer behaviors that mainly had four hears and they were greedy (貪心), curiosity (好奇心), vanity (虛榮心) and fear (恐懼心). After
that he briefed the benefits of Big Data included three main reasons included “Increase
Shareholder Value”, “Increase Customer Value” and “Increase Employee Value”.
The key steps used Big Data:
i)
Understand
ii)
Predict
iii)
Manage and
Control
Mr. Philip Chan then briefed
two types of thinking for Big Data that one is Intuition and the other is
Analysis. He explained the word of “context”
in Intuition thinking that related to feeling and the other similar word “content”
that related to fact.
After that he mentioned the
Big Data Analysis Framework as follows:
Discovery – Developing the
process and collecting the data
Insights – Organizing, analyzing,
and visualizing the data
Actions – Making decisions
based on the data
Outcomes – Executing the
decisions and measuring results
Planning sequence was Outcomes,
Actions, Insights and Discovery.
Reversely, implementing sequence was Discovery, Insights, Actions and Outcomes.
During the exercise,
trainer demonstrated that “When you focus on the details, you lose track of the
big picture.” Indicating that understanding the Problem or Outcomes required
you to see the big picture (zoom out) and focus on the details (zoom in). The six common mistakes when defining
business problems, objectives and/or goals were showed as following
diagram.
The three key components of
an effective problem statement was introduced and they were “Object”, “Deviation”
and “Evidence”. Then he briefed the goal
statement using SMART (Specific, Measurable, Attainable, Relevant and
Time-bound).
He also introduced Decision
Matrix of Impact vs Effort for Action stage. He suggested to start from Easy to
Difficult.
For Insights, four steps
for collecting the data showed as follows:
Step 1: What do you really
need to know in order to decide?
Step 2: What kind of data
are you going to measure?
Step 3: Where will the data
come from?
Step 4: What analytical
software and tools will you use?
And then he briefed some
common tools for Big Data.
Finally, trainer explained
some common mistakes when using Big Data to make decisions as follows:
“Good Data vs Bad Data”
“Correlation vs Causation”
“Flawed Assumptions”
At the end, Mr. Philip Chan
presented certificate to us and we took a photo for memory.
Reference:


沒有留言:
發佈留言